An agent in production improves by looking at what it did. The platform records every run with enough detail to answer, for any specific response, what came in, which steps ran, which model replied, which tools were used and how much it cost. This chapter explains what is recorded, where to see it and how we use it to find a problem and fix it.
What is recorded for each run
Each message an agent processes is a run. For each one, the platform keeps:
- the input message and the response;
- each step of the workflow, with the provider and model it used, the latency, the tokens, the estimated cost, the prompt the model received, what it replied and the tools it called;
- the total usage of the run;
- a timeline with the duration of each step.
Runs are grouped into sessions (chapter 6), and the session also keeps the full history and the memory summary the agent uses.
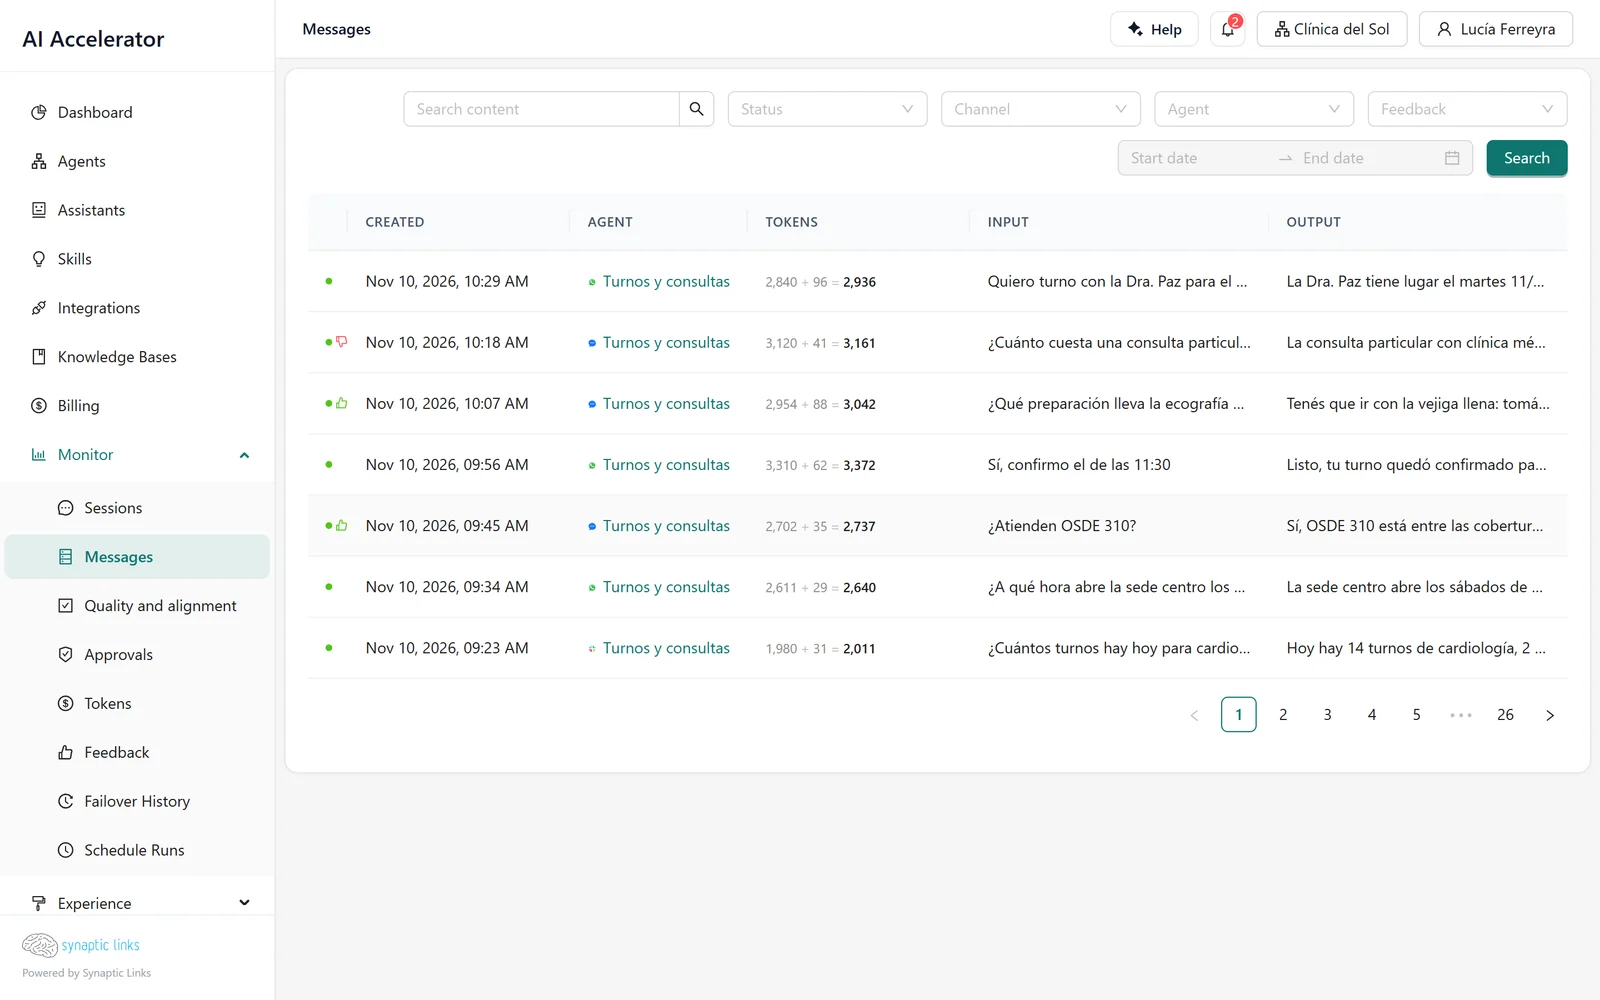
Monitor → Messages lists runs with their status, the agent and the channel, the tokens used and an excerpt of the input and output. Opening one shows the step-by-step detail.
From a negative vote to the cause
User feedback is the most direct way to find bad responses. A complete example:
- A patient asks in the widget how much a private consultation costs. The agent replies with an old price. The patient marks the response with 👎 and writes "that price is wrong".
- The platform stores the vote next to the message and, because it is negative, generates a negative feedback alert. If the tenant has Langfuse connected, the vote is also sent as a score.
- The tenant's admins see the alert in the admin notification bell. From there they reach Monitor → Feedback.
- In Feedback, the vote's row leads to the exact run in the history.
- The run detail shows the search step: it retrieved a fragment of
aranceles-2025.pdf. The document with the new fees was not in the knowledge base. - We upload the new document, delete the old one and check with the retrieval tester (chapter 4) that the correct fragment now comes back.
That path (vote, run, step, cause) is the improvement cycle. The per-step detail is what keeps it short: without it, "the agent answered badly" does not tell us whether the search, the model or a tool failed.
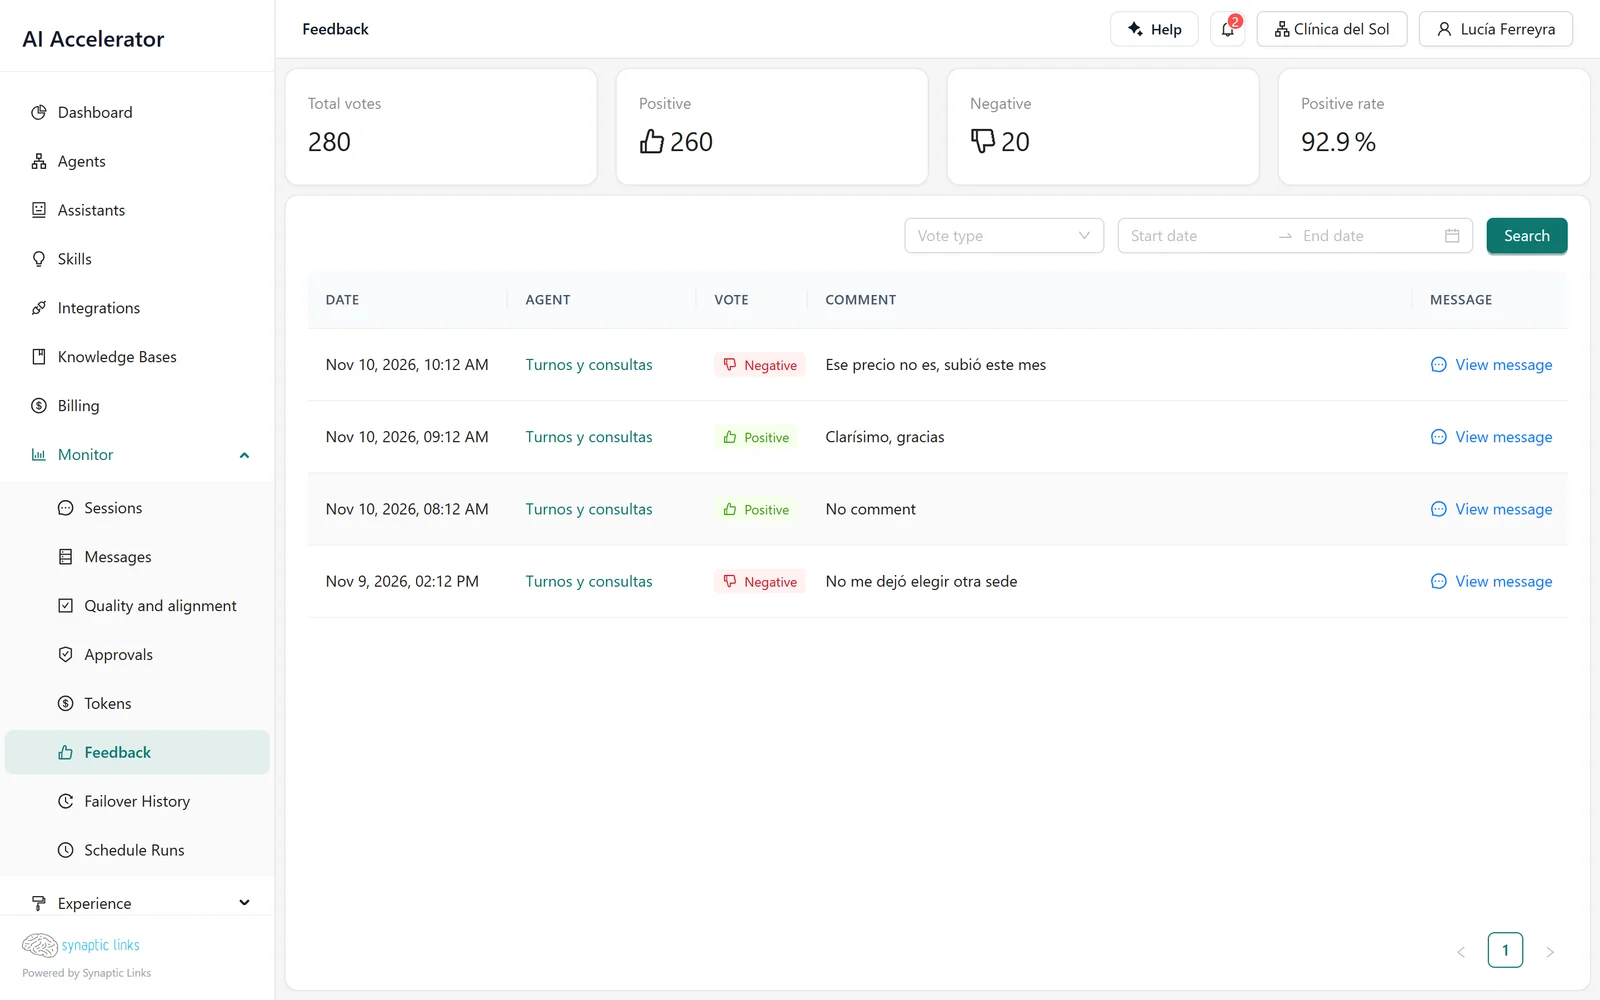
Voting is only available in the web widget, and each user can only vote on messages from their own session.
Health
The platform checks the configuration of every agent and every tenant, looking for what is going to fail before it fails:
- Critical: a node points to a model connection, an MCP connection or an OpenAPI source that no longer exists; the tenant has neither model connections nor inheritance.
- Warning: an agent has no active version.
- Information: a connection or source that no agent uses.
The Health section appears in the menu only when there is something to look at. If you see it, open it.
Usage and cost
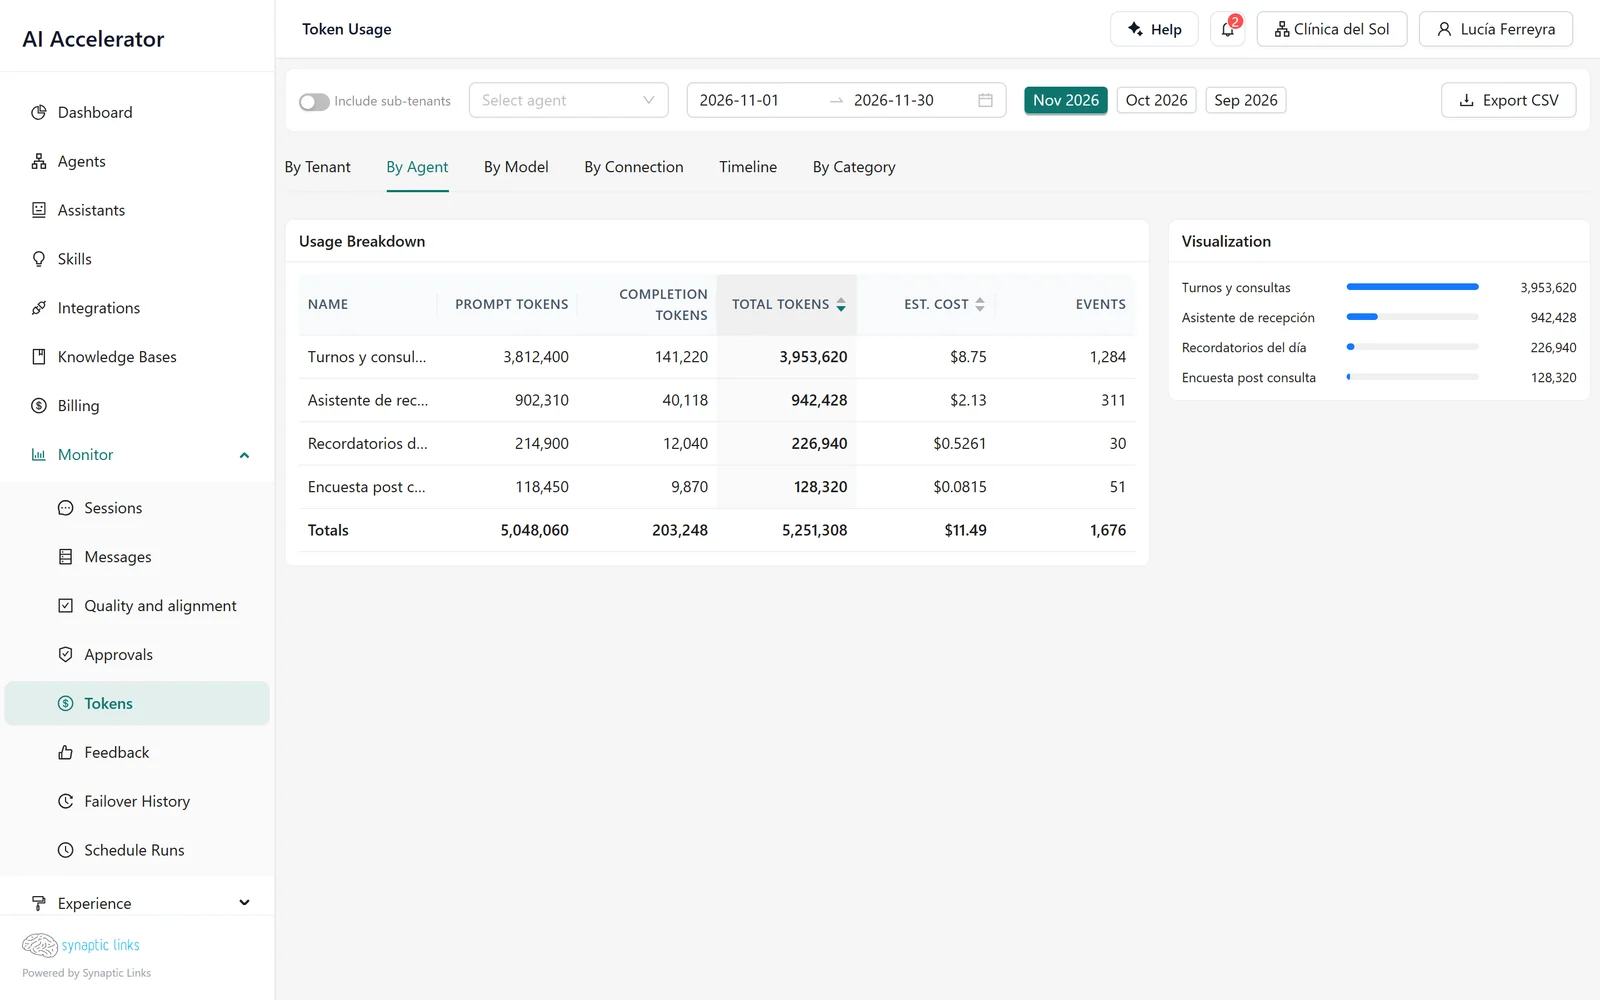
Monitor → Tokens groups usage by tenant, agent, model, connection, day or category, with input tokens, output tokens and the estimated cost.
The estimated cost is calculated in this order: the custom price we entered in the connection for that model, if there is one; otherwise, a table of known prices. That is why entering our contract price in each connection (chapter 2) makes this report match the provider's invoice.
What a client tenant is charged is calculated separately: with the custom price per model if there is one, or with the cost multiplied by the configured margin. That amount is deducted from the balance of the paying tenant, once per run.
Balance, limits and cut-offs
Before each inference the runtime checks, in order:
- The usage limits for the calendar month: number of messages and spend.
- The balance, if the tenant is prepaid: it must be greater than zero.
If either check fails, the run does not happen. When the balance crosses the low balance threshold the tenant defined, or reaches zero, an alert is generated.
There are also per-minute limits per tenant (chat, API and webhooks), with installation-wide defaults that a super admin can adjust per tenant (chapter 8). Voice has its own installation limit, unless the tenant has its own values: then it uses the webhook one. A request that exceeds them receives a limit-exceeded error.
Alerts
Important events (a conversation started, negative feedback, low or exhausted balance, a disabled webhook) generate alerts. Each alert type has a severity and, per role, who receives it and through which medium: in the admin bell, by email, or by outgoing webhook (chapter 5).
- Emails are grouped: at most one every 15 minutes per person, tenant and alert type. Alerts from that interval are added to the next email.
- Members of a parent tenant receive alerts from its children only if they chose to include them.
- Each person adjusts their preferences in Settings → My notifications: per tenant, per alert type and per medium —in the admin or by email—, with defaults based on their role. The preferences link in emails leads to that card.
- The bell checks for new alerts every minute. Mark all as read is on the notifications page.
Your profile
My profile holds your name, your language, your password —if your sign-in method allows it— and the linked sign-in providers. The email cannot be changed. The language can also be changed from the user menu, but it is stored in the browser, not in your user: on another computer it goes back to the browser's language.
The rest of Settings belongs to the tenant, not to you: its overview, the low-balance threshold and the webhooks.
Testing before a user complains
Feedback arrives after the bad answer. Monitor → Quality and alignment lets you get ahead of it: build a catalog of test cases from the agent's configuration, run it and review the evidence for each case. The guide Create tests with Quality and alignment builder walks through building one. Creating cases does not guarantee the agent is aligned: the result is reviewed after the run.
External observability
A tenant can connect Langfuse from the integrations catalogue. The traces of each run and the users' votes are sent there. If a tenant has no Langfuse of its own, the one from the nearest ancestor that has it is used.
How long it is kept
| Data | Default retention |
|---|---|
| Runs, messages, usage and feedback | 365 days |
| Message and tool audit | 30 days |
Deleting a session cascades to its messages, its feedback, its memory and its audit records. Only an owner can do it.
Where it stops
- The balance cut-off is "greater than zero". The check happens before the run and the deduction after it, so a run can leave the balance slightly below zero. Today there is no spending cap other than that.
- Per-minute limits are counted per runtime instance. With several instances, the effective limit is higher.
- After 30 days, the message audit is purged: the history still shows the run, but the session detail may stop listing its runs.
- The token report shows the provider's estimated cost, not the amount charged to the client.
- Health checks configuration, not the live availability of each MCP server.
- Feedback exists only in the web widget.
To check
- Someone on the team is an admin of the tenant and receives the negative feedback alerts.
- Each connection has its custom prices entered, so that the estimated cost is real.
- Prepaid tenants have a low balance threshold that leaves room to top up.
- The Health section does not appear in the menu: if it appears, there is something to resolve.
- Once a week, negative votes are traced to their cause, not just counted.